Spindle Helps Car Rental Operations Run More Efficiently
Real-time visibility into every vehicle, every employee, and every process. Know exactly what's happening across your fleet — and catch problems before they cascade.
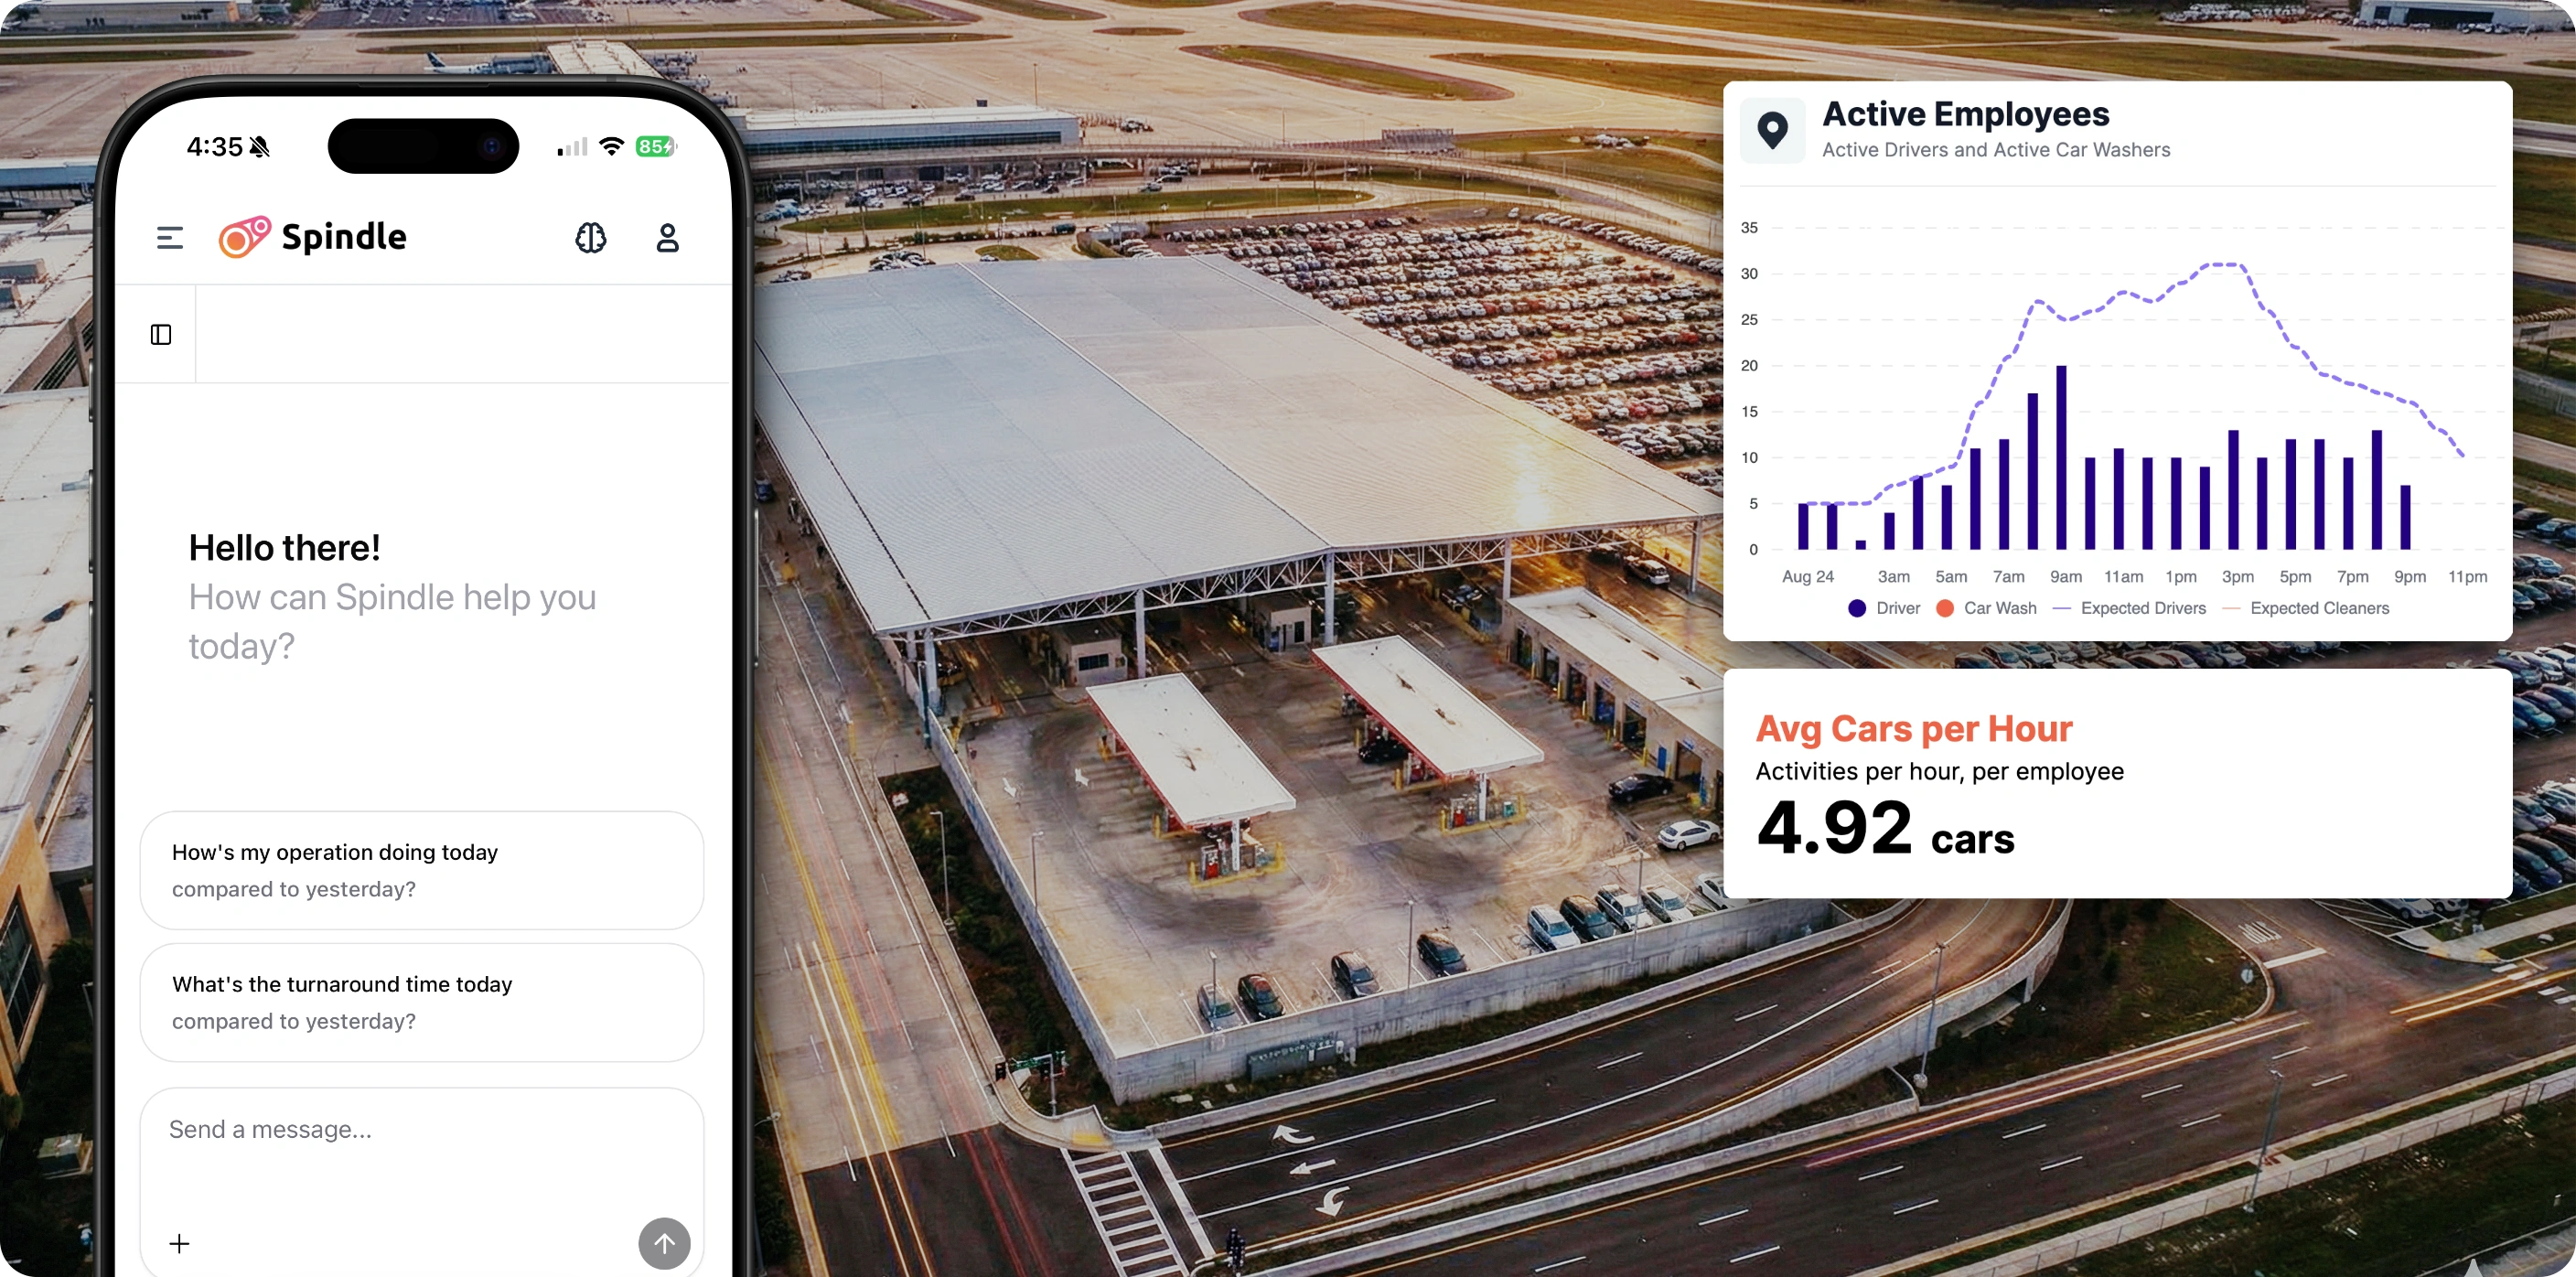
Know Exactly How Many Cars Per Hour Each Tech Is Turning
This is the number that matters: cars through QTA, per employee, per hour. Spindle gives you that number. For every tech. For every shift. For every day of the week.
- → Cars per hour by employee, shift, and day — tracked automatically
- → Side-by-side comparison of individual service agents, crews, and vendors
- → Trend analysis showing whether performance is improving or slipping
- → Real-time output tracking so you can course-correct mid-shift
The Spindle Difference: Other systems tell you that work happened. Spindle tells you how fast — and by whom.
Employee Throughput — This Week
LiveHidden Waste — Last 7 Days
Stop Paying for the Same Car Twice
That Altima went through QTA, hit the ready line, failed inspection, and looped back through cleaning. You paid for that car twice. Spindle catches the silent killers: recleans, failed inspections, stalled vehicles, skipped steps.
- → Reclean rates by employee, by vehicle type, by time of day
- → Failed post-QTA inspections and who's responsible
- → Vehicles stalled mid-process (and how long they sat)
- → Skipped checklist steps that lead to comebacks
The Hard Truth: Most operators we work with discover that 8-15% of their cleaning cycles are recleans nobody was tracking.
No More "I Think."
Only "I Know."
Your shift supervisor says Jose is your fastest detailer. Your cleaning vendor swears they're hitting turnaround targets. Are they right? Can you prove it? Can they prove it?
- → Individual performance metrics: cars serviced, time per task, idle time
- → Timestamped activity logs that answer "what did they do today?"
- → Independent verification of vendor hours and output delivered
- → SLA tracking with proof — not promises
For Your Vendors: Crew-level performance data so you know which teams to request — and documentation for every contract dispute you'll never have again.
Accountability Log — Today
| Employee/Vendor | Tasks | Avg Time | Status |
|---|---|---|---|
| Maria S. | 34 | 6.5 min | Verified |
| CleanCo Team A | 89 | 8.2 min | Verified |
| CleanCo Team B | 41 | 14.1 min | Flagged |
| James T. | 22 | 9.8 min | Verified |
Ask Spindle
Why did throughput drop Thursday afternoon?
Thursday 2-5pm throughput dropped 34% vs. your weekly average. Here's what I found:
Root Cause: Bay 2 sat empty during shift change (90 min). Combined with 3 techs on extended breaks, you lost capacity for ~18 vehicles.
An Operations Brain That Never Sleeps
Spindle's AI doesn't just show you data — it tells you what's wrong and what to do about it. It watches your operation 24/7, learns your patterns, and flags problems while you can still fix them.
- → Ask questions in plain English: "Why did throughput drop Thursday afternoon?"
- → Proactive alerts surface insights you didn't know you needed
- → Pattern recognition that identifies recurring bottlenecks
- → Staffing predictions based on historical demand
What It Catches: Your Tuesdays are 40% slower than Mondays, but you've been staffing them the same for years. The AI connected those dots.
The Results Speak
What You'll Discover in Week One
Most GMs find 12-18% of cleaning cycles are hidden recleans. They discover which techs are producing twice as much as others. They see, for the first time, exactly where their operation leaks time and money.